Note
Click here to download the full example code
Modeling Transposition Gain
Calculating the gain in insolation of a tilted module over a flat module.
This example shows how to evaluate the transposition gain of a racking strategy. The transposition gain is the additional insolation collected by orienting at a tilt instead of horizontal; using PV modeling lingo, it’s the increase in POA (plane of array) insolation over GHI (global horizontal irradiance) insolation.
This example uses a TMY dataset and the
pvlib.irradiance.get_total_irradiance() function to transpose
irradiance components to POA irradiance for various fixed tilts. It also
models a single-axis tracking system for comparison. The monthly POA
insolation is calculated for each strategy to show how orientation affects
seasonal irradiance collection.
import pvlib
from pvlib import location
from pvlib import irradiance
from pvlib import tracking
from pvlib.iotools import read_tmy3
import pandas as pd
from matplotlib import pyplot as plt
import pathlib

# get full path to the data directory
DATA_DIR = pathlib.Path(pvlib.__file__).parent / 'data'

# get TMY3 dataset
tmy, metadata = read_tmy3(DATA_DIR / '723170TYA.CSV', coerce_year=1990)
# TMY3 datasets are right-labeled (AKA "end of interval") which means the last
# interval of Dec 31, 23:00 to Jan 1 00:00 is labeled Jan 1 00:00. When rolling
# up hourly irradiance to monthly insolation, a spurious January value is
# calculated from that last row, so we'll just go ahead and drop it here:
tmy = tmy.iloc[:-1, :]

# create location object to store lat, lon, timezone
location = location.Location.from_tmy(metadata)

# calculate the necessary variables to do transposition.  Note that solar
# position doesn't depend on array orientation, so we just calculate it once.
# Note also that TMY datasets are right-labeled hourly intervals, e.g. the
# 10AM to 11AM interval is labeled 11.  We should calculate solar position in
# the middle of the interval (10:30), so we subtract 30 minutes:
times = tmy.index - pd.Timedelta('30min')
solar_position = location.get_solarposition(times)
# but remember to shift the index back to line up with the TMY data:
solar_position.index += pd.Timedelta('30min')


# create a helper function to do the transposition for us
def calculate_poa(tmy, solar_position, surface_tilt, surface_azimuth):
    # Use the get_total_irradiance function to transpose the irradiance
    # components to POA irradiance
    poa = irradiance.get_total_irradiance(
        surface_tilt=surface_tilt,
        surface_azimuth=surface_azimuth,
        dni=tmy['DNI'],
        ghi=tmy['GHI'],
        dhi=tmy['DHI'],
        solar_zenith=solar_position['apparent_zenith'],
        solar_azimuth=solar_position['azimuth'],
        model='isotropic')
    return poa['poa_global']  # just return the total in-plane irradiance


# create a dataframe to keep track of our monthly insolations
df_monthly = pd.DataFrame()

# fixed-tilt:
for tilt in range(0, 50, 10):
    # we will hardcode azimuth=180 (south) for all fixed-tilt cases
    poa_irradiance = calculate_poa(tmy, solar_position, tilt, 180)
    column_name = f"FT-{tilt}"
    # TMYs are hourly, so we can just sum up irradiance [W/m^2] to get
    # insolation [Wh/m^2]:
    df_monthly[column_name] = poa_irradiance.resample('m').sum()

# single-axis tracking:
orientation = tracking.singleaxis(solar_position['apparent_zenith'],
                                  solar_position['azimuth'],
                                  axis_tilt=0,  # flat array
                                  axis_azimuth=180,  # south-facing azimuth
                                  max_angle=60,  # a common maximum rotation
                                  backtrack=True,  # backtrack for a c-Si array
                                  gcr=0.4)  # a common ground coverage ratio

poa_irradiance = calculate_poa(tmy,
                               solar_position,
                               orientation['surface_tilt'],
                               orientation['surface_azimuth'])
df_monthly['SAT-0.4'] = poa_irradiance.resample('m').sum()

# calculate the percent difference from GHI
ghi_monthly = tmy['GHI'].resample('m').sum()
df_monthly = 100 * (df_monthly.divide(ghi_monthly, axis=0) - 1)

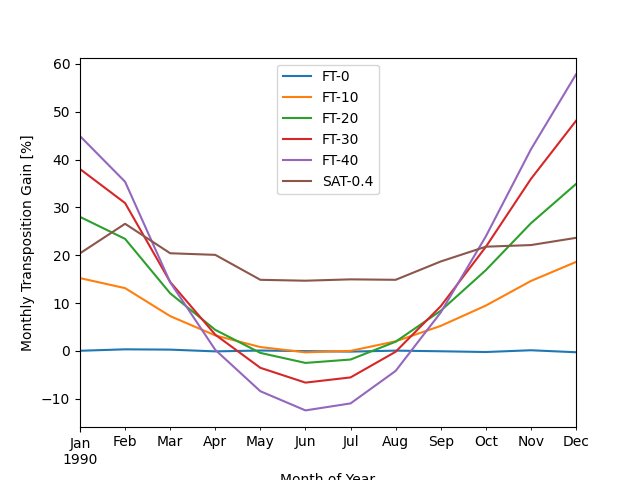
df_monthly.plot()
plt.xlabel('Month of Year')
plt.ylabel('Monthly Transposition Gain [%]')
plt.show()

Note that in summer, steeper tilts actually collect less insolation than flatter tilts because the sun is so high in the sky at solar noon. However, the steeper tilts significantly increase insolation capture in winter when the sun is lower in the sky. In contrast to the highly seasonal gain shown by fixed tilts, the tracker system shows a much more consistent gain year-round.
Because the seasonality of the fixed-tilt transposition gain is driven by solar position angles, the relative behavior of different orientations will be different for different locations. For example, a common rule of thumb (considered somewhat outdated today) used to be to set tilt equal to the latitude of the system location. At higher latitudes, the sun doesn’t get as high in the sky, so steeper tilts make more sense.
Total running time of the script: ( 0 minutes 0.506 seconds)