Note
Go to the end to download the full example code.
Obtaining ADR model parameters from IEC 61853 matrix measurements#
There’s a fitting function provided in pvlib to do exactly that.
Since PV module efficiency varies with irradiance and temperature what better way to train a model than using efficiency measurement over a broad range of temperature and irradiance levels? The standard IEC 61853-1 defines a standard matrix of conditions for such measurements and this example shows how the ADR model parameters can be determined with just a few lines of code using functions in pvlib-python.
Author: Anton Driesse
from io import StringIO
import pandas as pd
import matplotlib.pyplot as plt

from pvlib.pvarray import pvefficiency_adr, fit_pvefficiency_adr
Here are some matrix measurements:
iec61853data = '''
    irradiance  temperature     p_mp
0          100         15.0   30.159
1          200         15.0   63.057
2          400         15.0  129.849
3          600         15.0  197.744
4          800         15.0  264.825
5         1000         15.0  330.862
6          100         25.0   29.250
7          200         25.0   61.137
8          400         25.0  126.445
9          600         25.0  192.278
10         800         25.0  257.561
11        1000         25.0  322.305
12        1100         25.0  354.174
15         400         50.0  117.062
16         600         50.0  177.959
17         800         50.0  238.626
18        1000         50.0  298.954
19        1100         50.0  328.413
23         600         75.0  162.966
24         800         75.0  218.585
25        1000         75.0  273.651
26        1100         75.0  301.013
'''
df = pd.read_csv(StringIO(iec61853data), sep=r"\s+")
Now calculate the normalized or relative efficiency values and use the fitting function to determine the parameters. The parameters (shown below) can now be used to simulate the module operating in a PV system.
k_a   =  0.99924
k_d   = -5.49097
tc_d  =  0.01918
k_rs  =  0.06999
k_rsh =  0.26144
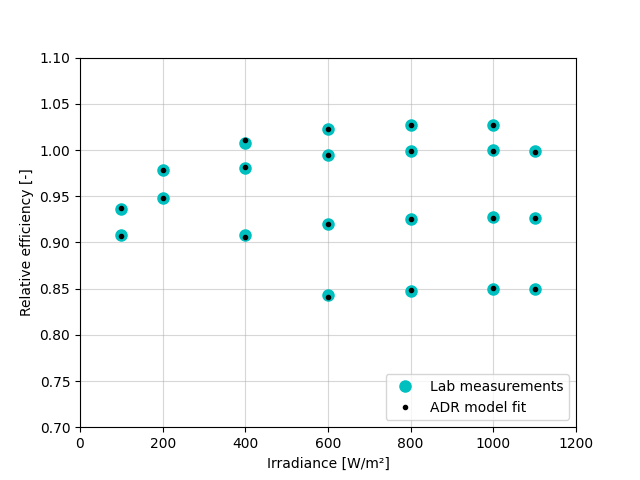
Compare the model output to the original measurements. The chart below shows minor differences but due to their random nature they are most likely evidence of the limitations of measurement accuracy.
eta_rel_adr = pvefficiency_adr(df['irradiance'],
                               df['temperature'], **adr_params)

plt.figure()
plt.plot(df['irradiance'], df['eta_rel'], 'oc', ms=8)
plt.plot(df['irradiance'], eta_rel_adr, '.k')
plt.legend(['Lab measurements', 'ADR model fit'], loc='lower right')
plt.xlabel('Irradiance [W/m²]')
plt.ylabel('Relative efficiency [-]')
plt.grid(alpha=0.5)
plt.xlim(0, 1200)
plt.ylim(0.7, 1.1)
plt.show()
References#
Total running time of the script: (0 minutes 0.114 seconds)