Note
Go to the end to download the full example code.
Seasonal Tilt#
Example of a custom Mount class.
Some PV systems are built with the option to adjust the module
tilt to follow seasonal changes in solar position. For example,
SAM calls this strategy “Seasonal Tilt”. This example shows how
to use a custom Mount class to use the Seasonal Tilt strategy
with ModelChain.
import pvlib
from pvlib import pvsystem, location, modelchain, iotools
from pvlib.temperature import TEMPERATURE_MODEL_PARAMETERS
import pandas as pd
import pathlib
import matplotlib.pyplot as plt
from dataclasses import dataclass
New Mount classes should extend pvlib.pvsystem.AbstractMount
and must implement a get_orientation(solar_zenith, solar_azimuth) method:
@dataclass
class SeasonalTiltMount(pvsystem.AbstractMount):
    monthly_tilts: list  # length 12, one tilt per calendar month
    surface_azimuth: float = 180.0

    def get_orientation(self, solar_zenith, solar_azimuth):
        # note: determining tilt based on month may produce different
        # results depending on the time zone of the timestamps
        tilts = [self.monthly_tilts[m-1] for m in solar_zenith.index.month]
        return pd.DataFrame({
            'surface_tilt': tilts,
            'surface_azimuth': self.surface_azimuth,
        }, index=solar_zenith.index)
First let’s grab some weather data and make sure our mount produces tilts like we expect:
DATA_DIR = pathlib.Path(pvlib.__file__).parent / 'data'
tmy, metadata = iotools.read_tmy3(DATA_DIR / '723170TYA.CSV', coerce_year=1990,
map_variables=True)
# shift from TMY3 right-labeled index to left-labeled index:
tmy.index = tmy.index - pd.Timedelta(hours=1)
weather = pd.DataFrame({
'ghi': tmy['ghi'], 'dhi': tmy['dhi'], 'dni': tmy['dni'],
'temp_air': tmy['temp_air'], 'wind_speed': tmy['wind_speed'],
})
loc = location.Location.from_tmy(metadata)
solpos = loc.get_solarposition(weather.index)
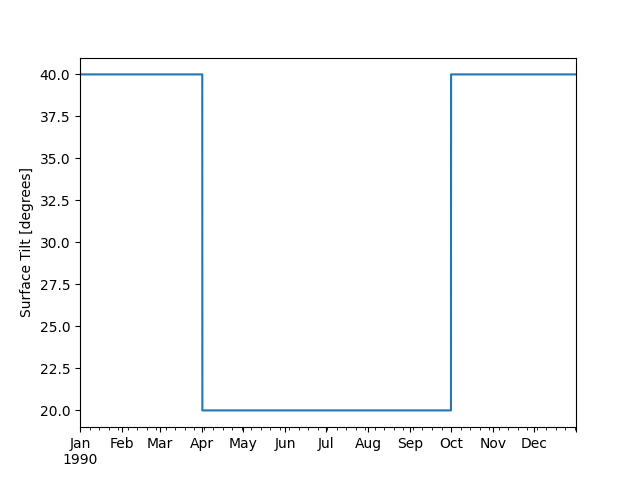
# same default monthly tilts as SAM:
tilts = [40, 40, 40, 20, 20, 20, 20, 20, 20, 40, 40, 40]
mount = SeasonalTiltMount(monthly_tilts=tilts)
orientation = mount.get_orientation(solpos.apparent_zenith, solpos.azimuth)
orientation['surface_tilt'].plot()
plt.ylabel('Surface Tilt [degrees]')
plt.show()
With our custom tilt strategy defined, we can create the corresponding Array and PVSystem, and then run a ModelChain as usual:
module_parameters = {'pdc0': 1, 'gamma_pdc': -0.004, 'b': 0.05}
temp_params = TEMPERATURE_MODEL_PARAMETERS['sapm']['open_rack_glass_polymer']
array = pvsystem.Array(mount=mount, module_parameters=module_parameters,
                       temperature_model_parameters=temp_params)
system = pvsystem.PVSystem(arrays=[array], inverter_parameters={'pdc0': 1})
mc = modelchain.ModelChain(system, loc, spectral_model='no_loss')

_ = mc.run_model(weather)
Now let’s re-run the simulation assuming tilt=30 for the entire year:
array2 = pvsystem.Array(mount=pvsystem.FixedMount(30, 180),
                        module_parameters=module_parameters,
                        temperature_model_parameters=temp_params)
system2 = pvsystem.PVSystem(arrays=[array2], inverter_parameters={'pdc0': 1})
mc2 = modelchain.ModelChain(system2, loc, spectral_model='no_loss')
_ = mc2.run_model(weather)
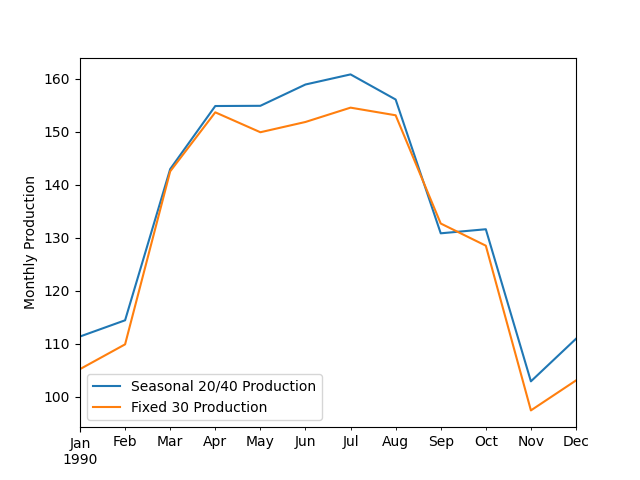
And finally, compare simulated monthly generation between the two tilt strategies:
results = pd.DataFrame({
    'Seasonal 20/40 Production': mc.results.ac,
    'Fixed 30 Production': mc2.results.ac,
})
results.resample('ME').sum().plot()
plt.ylabel('Monthly Production')
plt.show()
Total running time of the script: (0 minutes 0.486 seconds)