Note
Go to the end to download the full example code.
Reverse transposition using one year of hourly data#
With a brief look at accuracy and speed.
Author: Anton Driesse
Introduction#
When irradiance is measured on a tilted plane, it is useful to be able to estimate the GHI that produces the POA irradiance. The estimation requires inverting a GHI-to-POA irradiance model, which involves two parts: a decomposition of GHI into direct and diffuse components, and a transposition model that calculates the direct and diffuse irradiance on the tilted plane. Recovering GHI from POA irradiance is termed “reverse transposition.”
In this example we start with a TMY file and calculate POA global irradiance.
Then we use pvlib.irradiance.ghi_from_poa_driesse_2024() to estimate
the original GHI from POA global. Details of the method found in [1].
Another method for reverse tranposition called GTI-DIRINT is also
available in pvlib python (pvlib.irradiance.gti_dirint()).
More information is available in [2].
References#
import os
import time
import pandas as pd

import matplotlib.pyplot as plt

import pvlib
from pvlib import iotools, location
from pvlib.irradiance import (get_extra_radiation,
                              get_total_irradiance,
                              ghi_from_poa_driesse_2024,
                              aoi,
                              )
Read a TMY3 file containing weather data and select needed columns.
PVLIB_DIR = pvlib.__path__[0]
DATA_FILE = os.path.join(PVLIB_DIR, 'data', '723170TYA.CSV')

tmy, metadata = iotools.read_tmy3(DATA_FILE, coerce_year=1990,
                                  map_variables=True)

df = pd.DataFrame({'ghi': tmy['ghi'], 'dhi': tmy['dhi'], 'dni': tmy['dni'],
                   'temp_air': tmy['temp_air'],
                   'wind_speed': tmy['wind_speed'],
                   })
Shift the timestamps to the middle of the hour and calculate sun positions.
Estimate global irradiance on a fixed-tilt array (forward transposition). The array is tilted 30 degrees and oriented 30 degrees east of south.
TILT = 30
ORIENT = 150

df['dni_extra'] = get_extra_radiation(df.index)

total_irrad = get_total_irradiance(TILT, ORIENT,
                                   solpos.apparent_zenith,
                                   solpos.azimuth,
                                   df.dni, df.ghi, df.dhi,
                                   dni_extra=df.dni_extra,
                                   model='perez-driesse')

df['poa_global'] = total_irrad.poa_global
df['aoi'] = aoi(TILT, ORIENT, solpos.apparent_zenith, solpos.azimuth)
Now estimate ghi from poa_global using reverse transposition. The algorithm uses a simple bisection search, which is quite slow because scipy doesn’t offer a vectorized version (yet). For this reason we’ll process a random sample of 1000 timestamps rather than the whole year.
df = df[df.ghi > 0].sample(n=1000)
solpos = solpos.reindex(df.index)

start = time.process_time()

df['ghi_rev'] = ghi_from_poa_driesse_2024(TILT, ORIENT,
                                          solpos.apparent_zenith,
                                          solpos.azimuth,
                                          df.poa_global,
                                          dni_extra=df.dni_extra)
finish = time.process_time()

print('Elapsed time for reverse transposition: %.1f s' % (finish - start))
Elapsed time for reverse transposition: 3.8 s
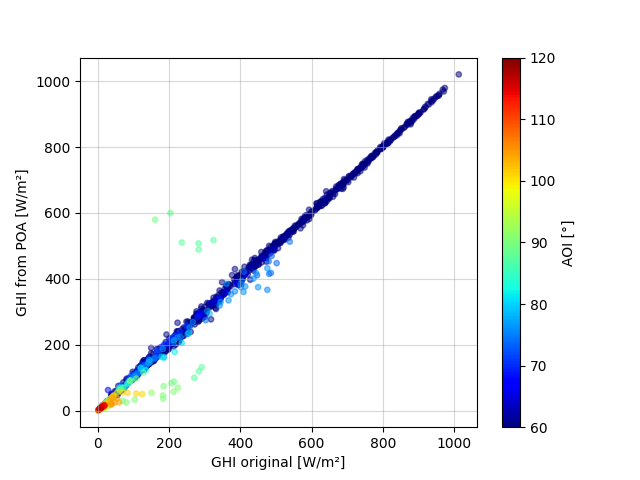
This graph shows the reverse transposed values vs. the original values. The markers are color-coded by angle-of-incidence to show that errors occur primarily with incidence angle approaching 90° and beyond.
Note that the results look particularly good because the POA values were calculated using the same models as used in reverse transposition. This isn’t cheating though. It’s a way of ensuring that the errors we see are really due to the reverse transposition algorithm. Expect to see larger errors with real-word POA measurements because errors from forward and reverse transposition will both be present.
df = df.sort_values('aoi')

plt.figure()
plt.gca().grid(True, alpha=.5)
pc = plt.scatter(df['ghi'], df['ghi_rev'], c=df['aoi'], s=15,
                 cmap='jet', vmin=60, vmax=120)
plt.colorbar(label='AOI [°]')
pc.set_alpha(0.5)

plt.xlabel('GHI original [W/m²]')
plt.ylabel('GHI from POA [W/m²]')

plt.show()
Total running time of the script: (0 minutes 4.053 seconds)