Note
Go to the end to download the full example code.
Fixed-Tilt Simulation with pvfactors#
Modeling the irradiance on the rear side of a fixed-tilt array.
Because pvfactors was originally designed for modeling single-axis
tracking systems, it’s not necessarily obvious how to use it to model
fixed-tilt systems correctly.
This example shows how to model rear-side irradiance on a fixed-tilt
array using pvlib.bifacial.pvfactors.pvfactors_timeseries().
Attention
To run this example, the solarfactors package (an implementation
of the pvfactors model) must be installed. It can be installed with
either pip install solarfactors or pip install pvlib[optional],
which installs all of pvlib’s optional dependencies.
import pandas as pd
from pvlib import location
from pvlib.bifacial.pvfactors import pvfactors_timeseries
import matplotlib.pyplot as plt
import warnings

# supressing shapely warnings that occur on import of pvfactors
warnings.filterwarnings(action='ignore', module='pvfactors')
First, generate the usual modeling inputs:
times = pd.date_range('2021-06-21', '2021-06-22', freq='1min', tz='Etc/GMT+5')
loc = location.Location(latitude=40, longitude=-80, tz=times.tz)
sp = loc.get_solarposition(times)
cs = loc.get_clearsky(times)

# example array geometry
pvrow_height = 1
pvrow_width = 4
pitch = 10
gcr = pvrow_width / pitch
axis_azimuth = 180
albedo = 0.2
Now the trick: since pvfactors only wants to model single-axis tracking
arrays, we have to pretend our fixed tilt array is a single-axis tracking
array that never rotates. In that case, the “axis of rotation” is
along the length of the row, with axis_azimuth 90 degrees offset from the
fixed surface_azimuth.
irrad = pvfactors_timeseries(
    solar_azimuth=sp['azimuth'],
    solar_zenith=sp['apparent_zenith'],
    surface_azimuth=180,  # south-facing array
    surface_tilt=20,
    axis_azimuth=90,  # 90 degrees off from surface_azimuth.  270 is ok too
    timestamps=times,
    dni=cs['dni'],
    dhi=cs['dhi'],
    gcr=gcr,
    pvrow_height=pvrow_height,
    pvrow_width=pvrow_width,
    albedo=albedo,
    n_pvrows=3,
    index_observed_pvrow=1
)

# turn into pandas DataFrame
irrad = pd.concat(irrad, axis=1)

irrad[['total_inc_back', 'total_abs_back']].plot()
plt.ylabel('Irradiance [W m$^{-2}$]')
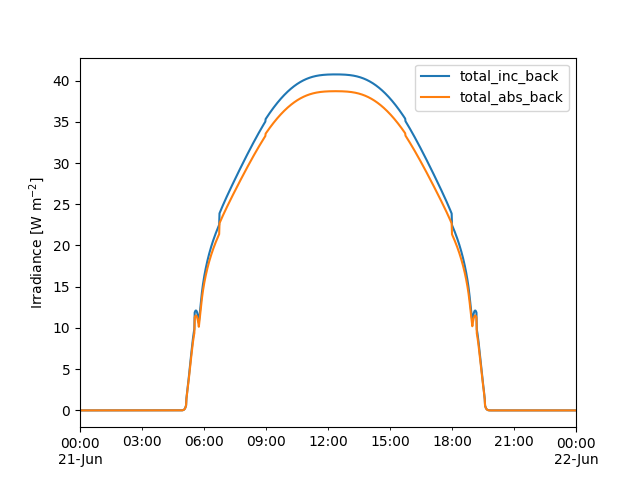
Text(46.722222222222214, 0.5, 'Irradiance [W m$^{-2}$]')
Total running time of the script: (0 minutes 0.341 seconds)