Note
Go to the end to download the full example code.
Diffuse Self-Shading#
Modeling the reduction in diffuse irradiance caused by row-to-row diffuse shading.
The term “self-shading” usually refers to adjacent rows blocking direct irradiance and casting shadows on each other. However, the concept also applies to diffuse irradiance because rows block a portion of the sky dome even when the sun is high in the sky. The irradiance loss fraction depends on how tightly the rows are packed and where on the module the loss is evaluated – a point near the top of edge of a module will see more of the sky than a point near the bottom edge.
This example uses the approach presented by Passias and Källbäck in [1]
and recreates two figures from that paper using
pvlib.shading.masking_angle_passias() and
pvlib.shading.sky_diffuse_passias().
References#
from pvlib import shading, irradiance
import matplotlib.pyplot as plt
import numpy as np
First we’ll recreate Figure 4, showing how the average masking angle varies
with array tilt and array packing. The masking angle of a given point on a
module is the angle from horizontal to the next row’s top edge and represents
the portion of the sky dome blocked by the next row. Because it changes
from the bottom to the top of a module, the average across the module is
calculated. In [1], k refers to the ratio of row pitch to row slant
height (i.e. 1 / GCR).
surface_tilt = np.arange(0, 90, 0.5)

plt.figure()
for k in [1, 1.5, 2, 2.5, 3, 4, 5, 7, 10]:
    gcr = 1/k
    psi = shading.masking_angle_passias(surface_tilt, gcr)
    plt.plot(surface_tilt, psi, label=f'k={k}')

plt.xlabel('Inclination angle [degrees]')
plt.ylabel('Average masking angle [degrees]')
plt.legend()
plt.show()
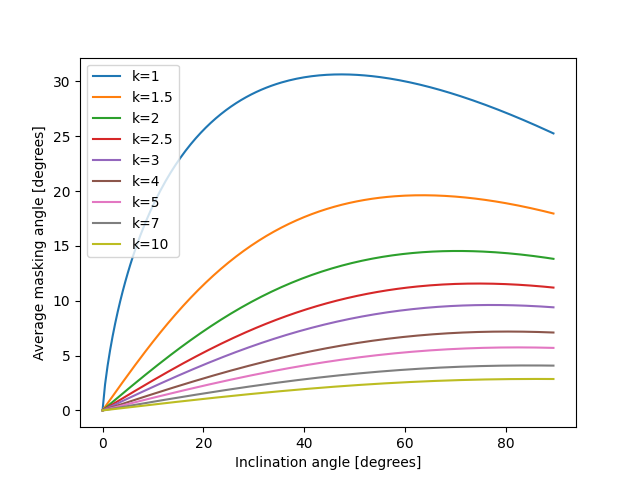
So as the array is packed tighter (decreasing k), the average masking
angle increases.
Next we’ll recreate Figure 5. Note that the y-axis here is the ratio of
diffuse plane of array irradiance (after accounting for shading) to diffuse
horizontal irradiance. This means that the deviation from 100% is due to the
combination of self-shading and the fact that being at a tilt blocks off
the portion of the sky behind the row. The first effect is modeled with
pvlib.shading.sky_diffuse_passias() and the second with
pvlib.irradiance.isotropic().
plt.figure()
for k in [1, 1.5, 2, 10]:
    gcr = 1/k
    psi = shading.masking_angle_passias(surface_tilt, gcr)
    shading_loss = shading.sky_diffuse_passias(psi)
    transposition_ratio = irradiance.isotropic(surface_tilt, dhi=1.0)
    relative_diffuse = transposition_ratio * (1-shading_loss) * 100  # %
    plt.plot(surface_tilt, relative_diffuse, label=f'k={k}')

plt.xlabel('Inclination angle [degrees]')
plt.ylabel('Relative diffuse irradiance [%]')
plt.ylim(0, 105)
plt.legend()
plt.show()
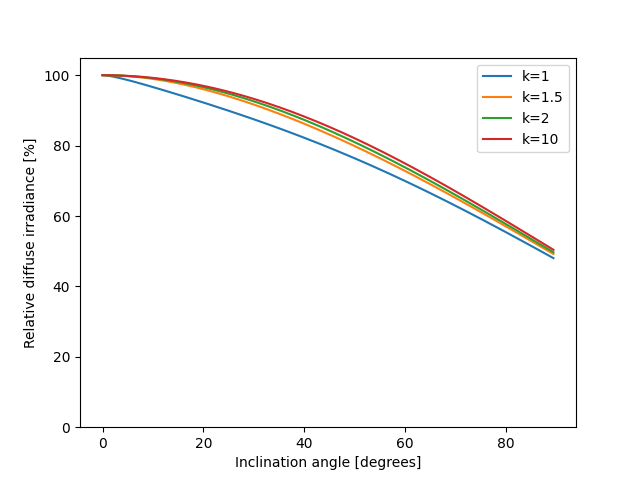
As k decreases, GCR increases, so self-shading loss increases and
collected diffuse irradiance decreases.
Total running time of the script: (0 minutes 0.162 seconds)