Note
Go to the end to download the full example code
4.7 MW CdTe single-axis tracking (OEDI System 9068)#
A basic model of a 4.7 MW single-axis tracking CdTe system located in Colorado, United States.
This example model uses satellite-based solar resource data from the NSRDB PSM3. This approach is useful for pre-construction energy modeling and in retrospective analyses where the system’s own irradiance measurements are not present or unreliable.
The system has public monitoring data available at the Open Energy Data Initiative (OEDI) under System ID 9068. For more information about the system, see its OEDI page.
import pvlib
import pandas as pd
import matplotlib.pyplot as plt
System parameters#
The system description on the OEDI provides some high-level system information, but unfortunately we have to make some guesses about other aspects of the system’s configuration.
The cells below define the system parameter values required in the simulation.
# information provided by system description on OEDI

latitude = 40.3864
longitude = -104.5512

# the inverters have identical PV array topologies:
modules_per_string = 15
strings_per_inverter = 1344
# "unofficial" information

# We know the system uses 117.5 W CdTe modules.  Based on the system vintage
# (data begins in 2017), it seems likely that the array uses First Solar
# Series 4 modules (FS-4117).
cec_module_db = pvlib.pvsystem.retrieve_sam('cecmod')
module_parameters = cec_module_db['First_Solar__Inc__FS_4117_3']
# ensure that correct spectral correction is applied
module_parameters['Technology'] = 'CdTe'

# default Faiman model parameters:
temperature_model_parameters = dict(u0=25.0, u1=6.84)
module_unit_mass = 12 / 0.72  # kg/m^2, taken from datasheet values

# The OEDI metadata says the inverters have AC capacities of 1910 kW,
# but the clipping level in the measured inverter output is more like 1840 kW.
# It's not clear what specific model is installed, so let's just assume
# this inverter, which the CEC database lists as having a nominal AC
# capacity of 1833 kW:
cec_inverter_db = pvlib.pvsystem.retrieve_sam('cecinverter')
inverter_parameters = cec_inverter_db['TMEIC__PVL_L1833GRM']

# We'll use the PVWatts v5 losses model.  Set shading to zero as it is
# accounted for elsewhere in the model, and disable availability loss since
# we want a "clean" simulation.
# Leaving the other pvwatts loss types (mismatch, wiring, etc) unspecified
# causes them to take their default values.
losses_parameters = dict(shading=0, availability=0)

# Google Street View images show that each row is four modules high, in
# landscape orientation.  Assuming the modules are First Solar Series 4,
# each of them is 600 mm wide.
# Assume ~1 centimeter gap between modules (three gaps total).
# And from Google Earth, the array's pitch is estimated to be about 7.0 meters.
# From these we calculate the ground coverage ratio (GCR):
pitch = 7  # meters
gcr = (4 * 0.6 + 3 * 0.01) / pitch

# The tracker rotation measurements reveal that the tracker rotation limits
# are +/- 60 degrees, and backtracking is not enabled:
max_angle = 60  # degrees
backtrack = False

# Google Earth shows that the tracker axes are very close to north-south:
axis_azimuth = 180  # degrees

# Estimated from Google Street View images
axis_height = 1.5  # meters
Create system objects#
The system has two inverters which seem to have identical specifications and arrays. To save some code and computation repetition, we will just model one inverter.
location = pvlib.location.Location(latitude, longitude)
mount = pvlib.pvsystem.SingleAxisTrackerMount(
    gcr=gcr,
    backtrack=backtrack,
    max_angle=max_angle,
    axis_azimuth=axis_azimuth
)
array = pvlib.pvsystem.Array(
    mount,
    module_parameters=module_parameters,
    modules_per_string=modules_per_string,
    temperature_model_parameters=temperature_model_parameters,
    strings=strings_per_inverter
)
system = pvlib.pvsystem.PVSystem(
    array,
    inverter_parameters=inverter_parameters,
    losses_parameters=losses_parameters
)

model = pvlib.modelchain.ModelChain(
    system,
    location,
    spectral_model='first_solar',
    aoi_model='physical',
    losses_model='pvwatts'
)
Fetch weather data#
The system does have measured plane-of-array irradiance data, but the measurements suffer from row-to-row shading and tracker stalls. In this example, we will use weather data taken from the NSRDB PSM3 for the year 2019.
api_key = 'DEMO_KEY'
email = 'your_email@domain.com'

keys = ['ghi', 'dni', 'dhi', 'temp_air', 'wind_speed',
        'albedo', 'precipitable_water']
psm3, psm3_metadata = pvlib.iotools.get_psm3(latitude, longitude, api_key,
                                             email, interval=5, names=2019,
                                             map_variables=True, leap_day=True,
                                             attributes=keys)
Pre-generate some model inputs#
This system’s trackers are configured to not backtrack, meaning the
array shades itself when the sun is low in the sky. pvlib’s
ModelChain currently has no shade modeling ability, so we will model
it separately.
Since this system uses thin-film modules, oriented in such a way that row-to-row shadows affect each cell in the module equally, we can assume that the effect of shading is linear with the reduction in incident beam irradiance. That means we can use pvlib’s infinite sheds model, which penalizes incident beam irradiance according to the calculated shaded module fraction and returns the average irradiance over the total module surface.
solar_position = location.get_solarposition(psm3.index, latitude, longitude)
tracker_angles = mount.get_orientation(
    solar_position['apparent_zenith'],
    solar_position['azimuth']
)
dni_extra = pvlib.irradiance.get_extra_radiation(psm3.index)

# note: this system is monofacial, so only calculate irradiance for the
# front side:
averaged_irradiance = pvlib.bifacial.infinite_sheds.get_irradiance_poa(
    tracker_angles['surface_tilt'], tracker_angles['surface_azimuth'],
    solar_position['apparent_zenith'], solar_position['azimuth'],
    gcr, axis_height, pitch,
    psm3['ghi'], psm3['dhi'], psm3['dni'], psm3['albedo'],
    model='haydavies', dni_extra=dni_extra,
)
ModelChain does not consider thermal transience either, so since we
are using 5-minute weather data, we will precalculate the cell
temperature as well:
cell_temperature_steady_state = pvlib.temperature.faiman(
    poa_global=averaged_irradiance['poa_global'],
    temp_air=psm3['temp_air'],
    wind_speed=psm3['wind_speed'],
    **temperature_model_parameters,
)

cell_temperature = pvlib.temperature.prilliman(
    cell_temperature_steady_state,
    psm3['wind_speed'],
    unit_mass=module_unit_mass
)
Run the model#
Finally, we are ready to run the rest of the system model. Since we want
to use pre-calculated plane-of-array irradiance, we will use
run_model_from_poa():
weather_inputs = pd.DataFrame({
    'poa_global': averaged_irradiance['poa_global'],
    'poa_direct': averaged_irradiance['poa_direct'],
    'poa_diffuse': averaged_irradiance['poa_diffuse'],
    'cell_temperature': cell_temperature,
    'precipitable_water': psm3['precipitable_water'],  # for the spectral model
})
model.run_model_from_poa(weather_inputs)
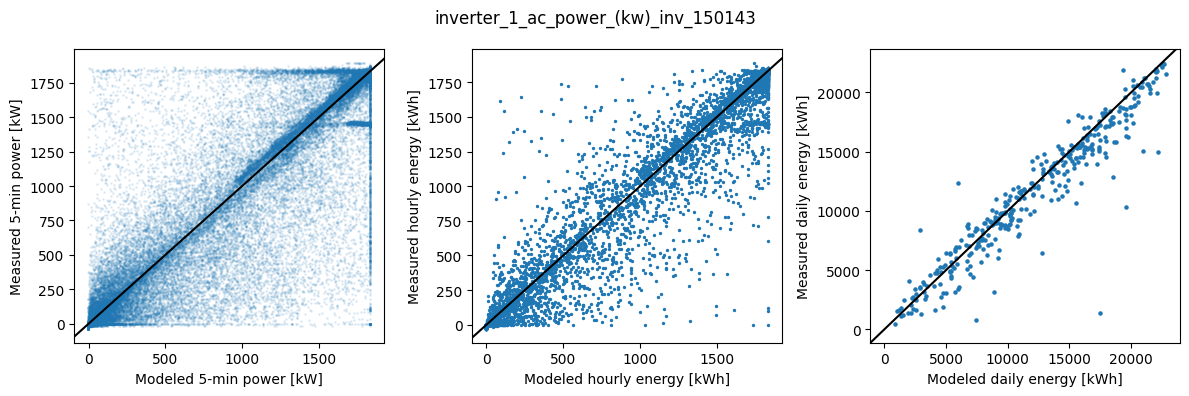
Compare with measured production#
Now, let’s compare our modeled AC power with the system’s actual inverter-level AC power measurements:
fn = r"path/to/9068_ac_power_data.csv"
df_inverter_measured = pd.read_csv(fn, index_col=0, parse_dates=True)
df_inverter_measured = df_inverter_measured.tz_localize('US/Mountain',
                                                        ambiguous='NaT',
                                                        nonexistent='NaT')
# convert to standard time to match the NSRDB-based simulation
df_inverter_measred = df_inverter_measured.tz_convert('Etc/GMT+7')
inverter_ac_powers = [
    'inverter_1_ac_power_(kw)_inv_150143',
    'inverter_2_ac_power_(kw)_inv_150144'
]
df = df_inverter_measured.loc['2019', inverter_ac_powers]
df['model'] = model.results.ac / 1000  # convert W to kW
for column_name in inverter_ac_powers:
    fig, axes = plt.subplots(1, 3, figsize=(12, 4))
    df.plot.scatter('model', column_name, ax=axes[0], s=1, alpha=0.1)
    axes[0].axline((0, 0), slope=1, c='k')
    axes[0].set_ylabel('Measured 5-min power [kW]')
    axes[0].set_xlabel('Modeled 5-min power [kW]')

    hourly_average = df.resample('h').mean()
    hourly_average.plot.scatter('model', column_name, ax=axes[1], s=2)
    axes[1].axline((0, 0), slope=1, c='k')
    axes[1].set_ylabel('Measured hourly energy [kWh]')
    axes[1].set_xlabel('Modeled hourly energy [kWh]')

    daily_total = hourly_average.resample('d').sum()
    daily_total.plot.scatter('model', column_name, ax=axes[2], s=5)
    axes[2].axline((0, 0), slope=1, c='k')
    axes[2].set_ylabel('Measured daily energy [kWh]')
    axes[2].set_xlabel('Modeled daily energy [kWh]')

    fig.suptitle(column_name)
    fig.tight_layout()

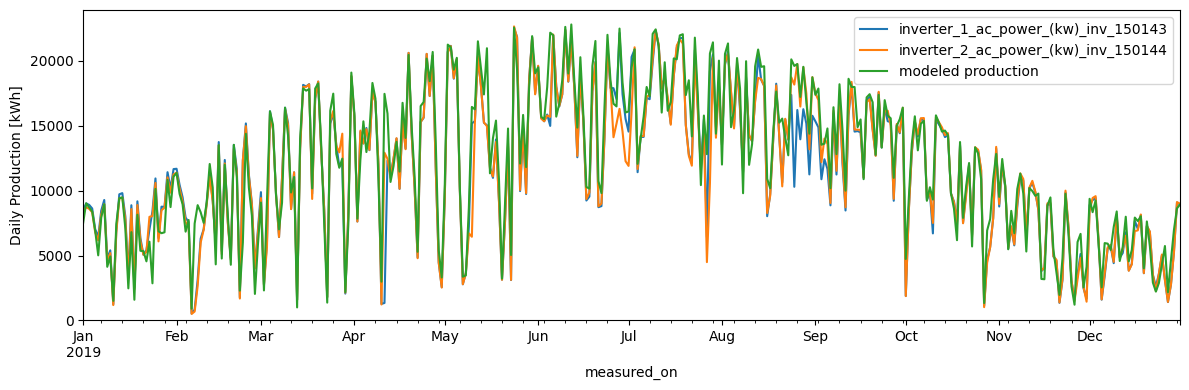
fig, ax = plt.subplots(figsize=(12, 4))
daily_energy = df.clip(lower=0).resample('h').mean().resample('d').sum()
daily_energy.plot(ax=ax)
plt.ylim(bottom=0)
plt.ylabel('Daily Production [kWh]')
plt.tight_layout()
Total running time of the script: (0 minutes 0.000 seconds)