pvlib.soiling.kimber#
- pvlib.soiling.kimber(rainfall, cleaning_threshold=6, soiling_loss_rate=0.0015, grace_period=14, max_soiling=0.3, manual_wash_dates=None, initial_soiling=0, rain_accum_period=24)[source]#
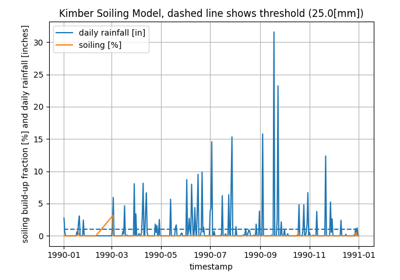
Calculates fraction of energy lost due to soiling given rainfall data and daily loss rate using the Kimber model.
Kimber soiling model [1] assumes soiling builds up at a daily rate unless the daily rainfall is greater than a threshold. The model also assumes that if daily rainfall has exceeded the threshold within a grace period, then the ground is too damp to cause soiling build-up. The model also assumes there is a maximum soiling build-up. Scheduled manual washes and rain events are assumed to reset soiling to zero.
- Parameters:
rainfall (pandas.Series) – Accumulated rainfall at the end of each time period. [mm]
cleaning_threshold (float, default 6) – Amount of daily rainfall required to clean the panels. [mm]
soiling_loss_rate (float, default 0.0015) – Fraction of energy lost due to one day of soiling. [unitless]
grace_period (int, default 14) – Number of days after a rainfall event when it’s assumed the ground is damp, and so it’s assumed there is no soiling. [days]
max_soiling (float, default 0.3) – Maximum fraction of energy lost due to soiling. Soiling will build up until this value. [unitless]
manual_wash_dates (sequence, optional) – List or tuple of dates as Python
datetime.datewhen the panels were washed manually. Note there is no grace period after a manual wash, so soiling begins to build up immediately.initial_soiling (float, default 0) – Initial fraction of energy lost due to soiling at time zero in the rainfall series input. [unitless]
rain_accum_period (int, default 24) – Period for accumulating rainfall to check against cleaning_threshold. The Kimber model defines this period as one day. [hours]
- Returns:
pandas.Series – fraction of energy lost due to soiling, has same intervals as input
Notes
The soiling loss rate depends on both the geographical region and the soiling environment type. Rates measured by Kimber [1] are summarized in the following table:
Region/Environment
Rural
Suburban
Urban/Highway/Airport
Central Valley
0.0011
0.0019
0.0020
Northern CA
0.0011
0.0010
0.0016
Southern CA
0
0.0016
0.0019
Desert
0.0030
0.0030
0.0030
Rainfall thresholds and grace periods may also vary by region. Please consult [1] for more information.
References